Why Trade Journaling Separates Winners from the Pack
In the high stakes world of trading, success hinges on discipline, adaptability, and self awareness. While most traders understand the basics of journaling—recording entries, exits, and profits—few harness its full potential. Legendary trader Paul Tudor Jones once said, “The secret to trading is there is no secret. It’s called work.” Advanced trade journaling is that work.
Studies, including a 2021 Fidelity analysis, reveal that traders who maintain consistent, detailed journals improve their performance by 30–40% over 12 months compared to those who don’t. Yet, most traders abandon their journals within weeks, dismissing them as tedious or unimpactful. The difference lies in methodology: elite traders treat journals not as diaries, but as data driven feedback systems.
This guide distills insights from psychologists, hedge fund managers, and trading coaches to help you transform your journal into a precision tool for growth.
Section 1: The Psychology of Journaling – Beyond “What” to “Why”
The Emotional Audit
Dr. Brett Steenbarger, trading psychologist and author of The Daily Trading Coach, argues that journals must answer two questions:
- What did I feel during this trade?
- How did my emotions distort my decisions?
Technique: Assign emotional scores (1–5) to key moments:
Pre Trade: Confidence, anxiety, boredom.
Midtrade: Fear of missing out (FOMO), regret, euphoria.
Post Trade: Relief, frustration, overconfidence.
Example:
“EUR/USD Short – 1:30 PM ET. Pre Trade confidence: 4/5 (saw bearish RSI divergence). Midtrade fear: 3/5 (price retraced 50%). Closed early. Post Trade regret: 4/5.”
Actionable Tip: Use color coding (red for fear driven exits, green for rule based wins) to visualize patterns.
Section 2: Quantitative Metrics – The Numbers That Matter
Van Tharp, renowned trading coach, insists that journals must quantify performance beyond P&L. Track these metrics:
- Expectancy Formula
Expectancy = (Win Rate × Average Win) – (Loss Rate × Average Loss)
A positive expectancy (>0) means your strategy works long term.
- Sharpe Ratio
Measures risk adjusted returns. Ideal for comparing strategies:
Sharpe Ratio = (Average Return – Risk Free Rate) / Standard Deviation of Returns
- Maximum Drawdown
Worst peak to trough decline. Helps assess psychological resilience.
Automation Hack: Sync your broker’s API with Excel or Google Sheets. Use formulas to auto calculate metrics.
Section 3: Strategy Specific Journaling – Context Is King
Mark Douglas, author of Trading in the Zone, emphasizes that “trades are probabilities, not certainties.” To isolate what works:
-
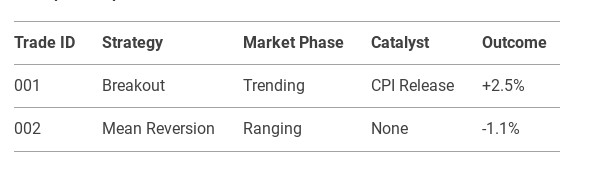
Categorize Trades by:
Strategy Type: Scalping, swing, position.
Market Phase: Trending, ranging, volatile.
Catalyst: Earnings, Fed announcements, technical breaks.
Example Template:
-
PreMortem Analysis
Borrowed from risk management experts: Before entering a trade, write:
“What could go wrong?”
“How will I adjust if support breaks?”
Post Trade, compare your premortem to reality.
Section 4: Leveraging Technology – From Manual to Automated
Tools of the Pros
TraderVue: Auto Imports trades, generates performance reports.
Edgewonk: Tracks behavioral biases and strategy efficiency.
TradingView + Google Sheets: Use webhooks to log entries directly from charts.
Python Script Example:
“`python
Analyze losing streaks
import pandas as pd
trades = pd.read_csv(‘trades.csv’)
losing_streaks = trades.groupby((trades[‘Outcome’] != ‘Win’).cumsum()).filter(lambda x: len(x) >= 3)
print(“Review these streaks:”, losing_streaks)
Section 5: The 4 Deadly Sins of Journaling (And How to Avoid Them)
-
Inconsistency
Solution: Set a daily 10 minute ritual. Use apps like Streaks or HabitBull to build discipline.
-
Surface Level Entries
Solution: Use the 5 Whys Technique:
“Why did I exit early?” → Fear.
“Why did I feel fear?” → Past trauma from a similar loss.
-
Ignoring External Factors
Log sleep, news events, and even caffeine intake. A 2020 Journal of Financial Markets study found sleep deprived traders under perform by 15%.
-
No Accountability
Share your journal with a mentor or peer group. As Naval Ravikant says, “Feedback loops are the lifeblood of improvement.”
Section 6: Case Studies – Lessons from the Trenches
Case Study 1: The Over trading Epidemic
Trader Profile: Day trader, 2 years experience, 8% annual return.
Journal Insight: 70% of losses occurred between 12–2 PM ET (low volatility).
Fix: Restricted trading to morning sessions. Result: +14% in 6 months.
Case Study 2: The Revenge Trading Spiral
Trader Profile: Crypto futures trader, blew two accounts.
Journal Insight: 90% of revenge trades followed losses >3%.
Fix: Implemented a mandatory 24 hour “cooling off” rule after large losses.
Section 7: The Review Process – Mining Gold from Data
Weekly Review Checklist
- Did I follow my trading plan?
- What was my largest draw-down?
- How did emotions impact decisions?
Quarterly Deep Dive
Back-test strategies against new market conditions.
Compare current metrics to historical averages.
Conclusion: The Journal as Your Trading Compass
Advanced trade journaling isn’t about perfection—it’s about progress. By marrying emotional honesty with ruthless data analysis, you’ll uncover hidden biases, refine strategies, and build unshakable discipline. As Linda Raschke, a 30 year trading veteran, puts it: “Your journal is the only place where the market can’t lie to you.”
Commit to the process, and let your journal illuminate the path from randomness to mastery.
Further Resources
Books: Trading Journals for Dummies by Roland Ullrich, The Playbook by Mike Bellafiore.
Tools: Edgewonk, TraderSync, TradingView.
Blog Post:
Top 5 Side Hustles for Beginners in 2025
Top 10 Best Technical Analysis Books